


Augmented Reality for Product Brands: a Practical Guide
US shoppers returned 19.3% of online orders in 2025 (NRF). A practical guide to where AR earns its cost for product brands, and how it ships in 2026.
.webp)
In 2025, American shoppers sent back an estimated 19.3% of everything they bought online, according to the National Retail Federation and Happy Returns in the 2025 Retail Returns Landscape. Most of those returns come down to one gap. The product on the screen did not match the product in the room. Augmented reality closes part of that gap by putting the item into the customer's actual space at actual scale, before the order.
This guide covers what AR does for a product brand, which categories justify the build, how AR reaches a phone in 2026, and what a project actually costs you in time and asset work. It also covers what changed this year, because the WebAR delivery stack shifted underneath everyone in February.
Key Takeaways
- US online return rates hit 19.3% in 2025 (NRF and Happy Returns). AR targets the fit and scale uncertainty that drives them.
- The widely quoted "94% conversion lift" is a 2022 Shopify platform figure, self-reported. Treat it as directional.
- AR earns its cost in four categories: furniture, footwear and eyewear, beauty, and large or configurable goods.
- 8th Wall retired its hosted platform in February 2026. Model-viewer plus USDZ is now the default path.

What Is Augmented Reality for Product Brands?
Augmented reality places a 3D model of your product into the customer's real environment through a phone camera, at real scale, with real shadows. It differs from a 3D viewer, which shows the product spinning on a white background inside the page. It differs from virtual reality, which replaces the room entirely. AR keeps the room and adds the product.
For a product brand, that distinction is commercial rather than technical. A 3D viewer answers "what does it look like." AR answers "does it work in my space, on my face, on my feet." The second question is the one that stops the checkout.
Two delivery routes exist. Native AR lives inside an installed app and gives you the most control over tracking and rendering. WebAR runs in the mobile browser from a link or a QR code, with no install step. For most product brands, the install requirement kills the funnel before it starts, which is why WebAR carries the majority of retail AR traffic.
What Does AR Actually Fix in Ecommerce?
AR attacks return rates and purchase hesitation, which are the same problem measured at two moments. In 2025, the NRF and Happy Returns put total US retail returns at $849.9 billion, or 15.8% of annual sales, with the online channel running considerably higher at 19.3%. Fit and scale account for a large share of that volume.
The consumer-side evidence points the same direction. In a survey of 4,028 shoppers under 50 across the US, UK, France and Saudi Arabia, Snap Inc. with Publicis Media and Alter Agents found that AR use raised shoppers' certainty about their online purchases by 80%. Certainty before checkout is what a return policy is paying for after it.
Amazon's own data, cited in Shopify's 2025 overview of 3D model generation for ecommerce, showed customers were twice as likely to buy after using AR Virtual Try-On or View in 3D. Listings that simply offered the View in Your Room feature saw a 9% average lift in sales, whether or not the shopper opened it. Availability alone carries signal.
Our finding: the second Amazon number matters more than the first. A 9% lift among shoppers who never tapped the AR button means the feature works partly as a trust marker on the page. That reframes the business case. You are not only buying interaction. You are buying the badge that says this brand knows its own product well enough to model it.
How Much of the AR Conversion Data Should You Trust?
The "94% conversion lift" number appears in almost every AR sales deck. It traces to a single Shopify changelog entry from May 2022 announcing 3D and AR previews in the Shop app, which reported that merchants adding 3D content saw a 94% conversion lift on average. It is self-reported, platform-level, four years old, and not broken out by category or traffic source.
That does not make it false. It makes it directional. The figure describes merchants who chose to invest in 3D content, which is a self-selecting group with better product pages generally. Any agency quoting it as a forecast for your store is quoting a benchmark as a promise.
The defensible version of the claim is narrower. AR and 3D content correlate with higher conversion in visualization-dependent categories, with effect sizes reported anywhere between 9% and 94% depending on who measured, when, and what they counted. Build your business case on your own return rate and average order value, then treat published lifts as a range rather than a target.
The market growth data is more stable. Grand View Research valued AR in ecommerce at $5.88 billion in 2024 and forecast $38.5 billion by 2030, a 35.8% compound annual growth rate, with virtual try-on holding the largest application share. Category growth is a reasonable input for a five-year plan. Conversion benchmarks from other people's stores are not.
Which Products Justify an AR Build?
AR pays off where the purchase decision depends on scale, fit, or appearance in context. Four categories clear that bar consistently.
1. Furniture and home goods. The strongest case. A sofa is a spatial decision, returns are expensive to reverse, and the customer already thinks in terms of the room. Room placement AR turns an abstract dimension list into a visible object against the customer's own wall.
2. Footwear and eyewear. Fit-driven and face or body anchored. Apparel and footwear carry the highest category return rates in ecommerce, driven almost entirely by sizing and appearance. Try-on AR gives the shopper the appearance half of that answer immediately.
3. Beauty. The most mature AR category, and the one consumers already expect. Shade matching on a live camera feed removes the single biggest hesitation in buying color cosmetics without a counter.
4. Large, configurable, or technical goods. Appliances, equipment, industrial parts, modular systems. Low volume, high ticket, and a buyer who needs to verify dimensions before committing. This category is the most underused, and it is where the competitive gap is widest right now.
Categories that rarely justify the build: consumables, commodity goods, anything under roughly $30, and products where the customer's decision turns on specification rather than appearance.
How Does AR Reach a Customer's Phone in 2026?
The delivery stack changed this year. On 28 February 2026, Niantic retired 8th Wall's hosted platform, the tool that carried a large share of brand WebAR campaigns for seven years. Published experiences keep running until 28 February 2027, after which the hosting is decommissioned. The engine was released as open source under an MIT license, with SLAM tracking held back.
For any brand running an AR campaign built on 8th Wall, that is an operational deadline rather than a news item. Dynamic QR codes can be redirected. Static printed codes cannot.
What remains is a two-format standard that has quietly become the default. You ship a GLB file for the web and Android, and a USDZ file for iOS. Google's model-viewer web component reads both, renders an interactive 3D view on the page, and routes the AR button to the right handler per device. Scene Viewer or WebXR on Android, AR Quick Look on iOS.
The constraint worth planning around: Safari on iPhone still does not expose handheld WebXR AR in 2026. Apple's route is AR Quick Look with a USDZ file, documented in Apple's own developer material. Teams that build a WebXR experience, test it on Android, and ship the QR code discover this when half the scans return a black screen.
The practical implication: for room placement and try-on, model-viewer plus a clean GLB and USDZ pair covers the entire mobile market with no install, no vendor licence, and no platform risk. The work shifts almost entirely to the 3D pipeline. That is where the budget and the schedule actually go.
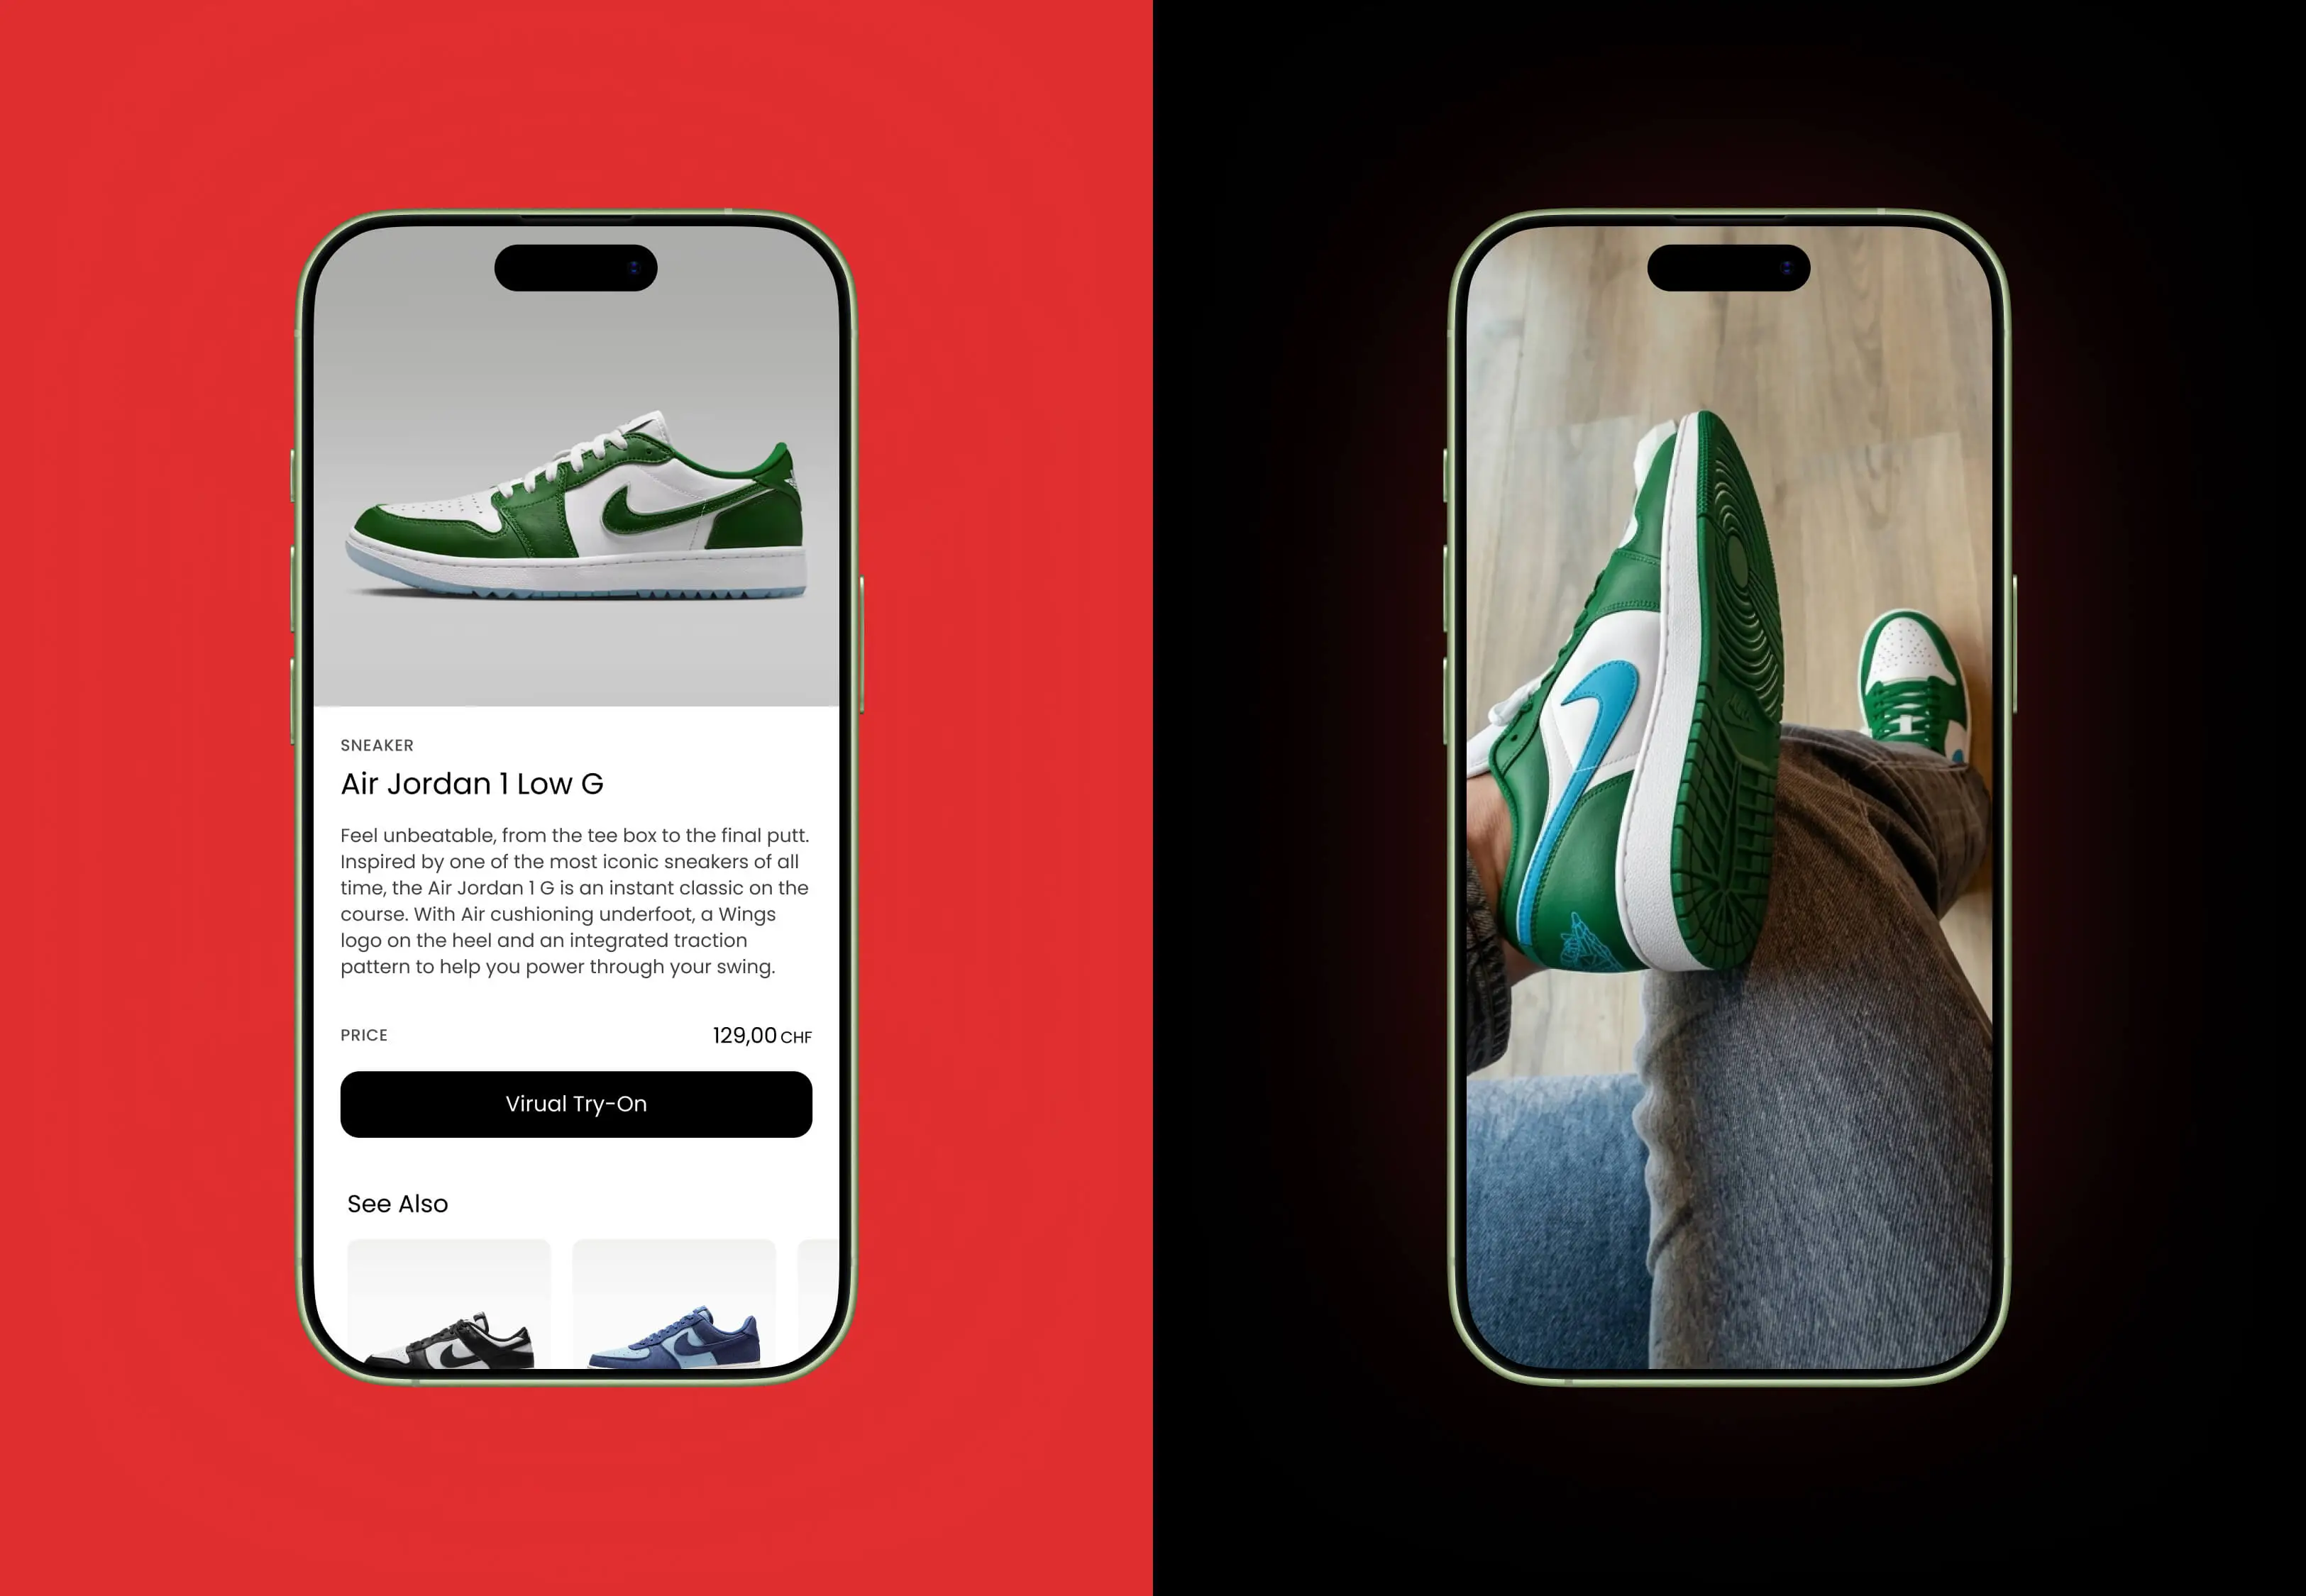
What We Learned Building Sole
We built Sole, our AR footwear try-on, on a proprietary engine with the DeepAR SDK handling real-time tracking. It is a studio product rather than a client project, which meant we absorbed every technical decision ourselves instead of scoping around a deadline.
Our finding: the engine was never the hard part. Foot tracking behaved. What consumed the schedule was material authoring. A sneaker's credibility in AR lives in how the leather catches light and how the sole sits against the floor plane, and getting that right required more iteration than the tracking layer ever did.
Three things we would tell any brand starting an AR project:
Model quality sets the ceiling on everything downstream. A poorly optimized model reads as a broken feature, and customers transfer that judgment to the product itself. Budget for the asset work first.
Weight is a hard limit, not a preference. Mobile data means a five-second load ceiling. Keep geometry lean and compress textures with KTX2 or Draco, or the experience never opens.
Test on a mid-range Android device before anything else. Flagship phones hide performance problems that half your traffic will hit.
Our full capability set for 3D and AR work sits on the 3D-powered experiences page.
What Does an AR Project Actually Require?
Four phases, in order, with the asset pipeline consuming most of the calendar.
Scoping. Choose the SKUs where visualization drives the decision. Starting with three to five products beats modeling the catalogue and discovering the format does not suit half of it.
Asset production. Model, texture, and optimize each product, then export the GLB and USDZ pair from a single source model. This is the longest phase and the one that determines quality.
Integration. Embed the viewer on the product page, wire the AR entry point, and handle camera permissions over HTTPS. Camera-based AR fails silently on HTTP.
Measurement. Instrument AR opens, dwell time, and the return rate on AR-touched orders against a control group. Without the last one, you cannot prove the investment paid.
If you want the decision framed against your own catalogue rather than a benchmark, start a conversation with the studio.
The Short Version
AR is a visualization tool with a narrow, provable job: removing the uncertainty that produces returns and abandoned carts in categories where scale and fit decide the purchase. It is not a campaign gimmick and it is not a fit for every catalogue.
The technical barrier has largely dissolved. A GLB, a USDZ, and model-viewer reach every modern phone without an install or a licence. What remains is the 3D craft, which is where quality separates an AR feature that sells from one that customers assume is broken.
Start with three products where the room or the fit decides the sale. Measure the return rate on AR-touched orders. Expand from evidence.
The evidence is directional rather than settled. Snap, Publicis Media and Alter Agents found AR use raised purchase certainty by 80% among surveyed shoppers. Against a 19.3% online return rate (NRF, 2025), even a partial reduction changes the margin on fit-sensitive categories.
No. WebAR runs in the mobile browser from a link or QR code with no install. On iPhone, tapping the AR button opens AR Quick Look natively in Safari. On Android, it opens Scene Viewer or a WebXR session. The install-free path covers effectively the whole mobile market.
Often more so. A focused catalogue of high-consideration products carries better AR economics than a broad low-ticket range, because the asset cost per SKU is fixed and the return cost you avoid is higher.
Two per product. GLB for the web and Android, USDZ for iOS AR Quick Look. Both export from a single source model. Delivering only one format halves your reachable audience.
Niantic retired the hosted platform on 28 February 2026 and open-sourced the engine under MIT. Existing published experiences run until 28 February 2027. Brands with live 8th Wall campaigns need a migration path before that date.








%20(1).svg)